


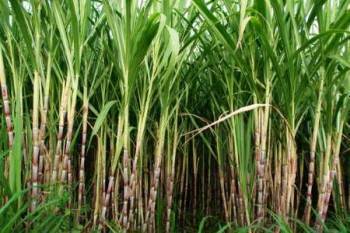


MUMBAI, 26 December 2025: Sugarcane production in India has shown a steady upward trend over the last five years, with the exception of a marginal decline in 2023–24. Production increased from 4,053.99 lakh tonnes in 2020–21 to 4,546.11 lakh tonnes in 2024–25, reflecting an overall rise of 492.12 lakh tonnes during the period. According to the first advance estimates for 2025–26, sugarcane production is projected to further increase to 4,756.14 lakh tonnes.
Farmers’ payments, however, are not determined solely by production levels. Prices fixed under the Fair and Remunerative Price (FRP) mechanism and State Advised Price (SAP) also play a crucial role in ensuring remunerative returns to sugarcane growers. Timely policy interventions by the Government—including advance declaration of FRP, facilitation of diversion of surplus sugar towards ethanol production, and decisions related to sugar exports—have enabled sugar mills to make prompt payments to farmers.
The FRP for sugarcane has been progressively enhanced from ₹285 per quintal in 2020–21 to ₹340 per quintal in 2024–25, and further increased to ₹355 per quintal for the 2025–26 season. This consistent rise in FRP, combined with increasing sugarcane production, reflects a positive trend in farmer incomes and highlights the impact of coordinated pricing and policy support in the sugar sector.
The State-wise sugarcane area in the country during the last five years is provided in Annexure II. The State-wise sugarcane production in the country during the last five years is given in Annexure I.
Annexure-I
State-wise Production of Sugarcane
Source: DA&FW
| States/Uts | Production (Thousand Tonnes) | ||||
| 2020-21 | 2021-22 | 2022-23 | 2023-24 | 2024-25 | |
| Andaman And Nicobar Islands | 0.00 | 2.91 | 2.99 | 2.26 | 0.42 |
| Andhra Pradesh | 4138.64 | 3645.41 | 2955.72 | 2213.85 | 1985.32 |
| Arunachal Pradesh | 46.44 | 46.29 | 46.57 | 46.68 | 46.86 |
| Assam | 1093.13 | 1160.03 | 1264.07 | 1379.85 | 1237.52 |
| Bihar | 12109.80 | 12025.58 | 12742.63 | 12084.10 | 12149.50 |
| Chhattisgarh | 1756.39 | 1958.04 | 2388.24 | 2040.61 | 1866.38 |
| Dadra And Nagar Haveli | 0.00 | 0.00 | 0.00 | 0.00 | 0.00 |
| Goa | 35.63 | 35.34 | 30.50 | 25.66 | 21.51 |
| Gujarat | 16954.72 | 17459.11 | 13461.47 | 14480.33 | 13714.33 |
| Haryana | 8531.72 | 8822.57 | 8860.50 | 7373.60 | 5830.21 |
| Himachal Pradesh | 22.68 | 22.65 | 22.23 | 22.09 | 20.55 |
| Jammu And Kashmir | 0.08 | 0.00 | 0.27 | 0.27 | 0.27 |
| Jharkhand | 0.00 | 0.00 | 0.00 | 0.00 | 33.88 |
| Karnataka | 42528.00 | 61152.00 | 59346.00 | 41811.00 | 48060.00 |
| Kerala | 106.66 | 10.43 | 101.24 | 75.86 | 21.11 |
| Madhya Pradesh | 5440.65 | 5379.12 | 6443.68 | 7590.00 | 6108.63 |
| Maharashtra | 105137.60 | 116076.40 | 123968.16 | 112087.56 | 109970.18 |
| Manipur | 279.41 | 279.41 | 289.51 | 278.26 | 290.19 |
| Meghalaya | 0.39 | 0.40 | 0.37 | 0.36 | 0.36 |
| Mizoram | 42.96 | 36.95 | 41.37 | 24.23 | 21.31 |
| Nagaland | 203.02 | 104.59 | 108.49 | 115.11 | 87.08 |
| Odisha | 381.31 | 397.61 | 394.21 | 411.86 | 680.74 |
| Puducherry | 187.04 | 0.00 | 161.16 | 150.80 | 92.25 |
| Punjab | 7487.00 | 7130.88 | 7506.01 | 7509.51 | 7279.48 |
| Rajasthan | 393.74 | 321.43 | 310.22 | 345.34 | 465.47 |
| Tamil Nadu | 13284.63 | 16166.43 | 17658.39 | 15927.45 | 13350.78 |
| Telangana | 1750.98 | 2864.57 | 2942.72 | 2433.13 | 1916.19 |
| Tripura | 48.58 | 48.41 | 37.89 | 37.89 | 29.72 |
| Uttar Pradesh | 178339.26 | 179167.10 | 224245.87 | 215810.94 | 220801.27 |
| Uttarakhand | 3680.00 | 3520.00 | 3760.00 | 7776.00 | 7650.21 |
| West Bengal | 1418.25 | 1591.25 | 1442.89 | 1103.88 | 879.26 |
| All India | 405398.71 | 439424.89 | 490533.35 | 453158.49 | 454610.97 |
Annexure-II
State-wise Area of Sugarcane
Source: DA&FW
| States/Uts | Area (Thousand Hectares) | ||||
| 2020-21 | 2021-22 | 2022-23 | 2023-24 | 2024-25 | |
| Andaman And Nicobar Islands | 0.00 | 0.14 | 0.13 | 0.13 | 0.07 |
| Andhra Pradesh | 55.00 | 47.00 | 40.00 | 27.49 | 22.00 |
| Arunachal Pradesh | 2.15 | 2.15 | 2.16 | 2.17 | 2.17 |
| Assam | 30.50 | 29.77 | 29.00 | 29.22 | 29.23 |
| Bihar | 221.12 | 211.16 | 210.18 | 202.15 | 192.57 |
| Chhattisgarh | 31.55 | 34.94 | 41.98 | 35.70 | 33.37 |
| Dadra And Nagar Haveli | 0.00 | 0.00 | 0.00 | 0.00 | 0.00 |
| Goa | 0.55 | 0.53 | 0.49 | 0.45 | 0.40 |
| Gujarat | 219.26 | 222.96 | 181.07 | 202.18 | 188.77 |
| Haryana | 99.00 | 107.70 | 107.75 | 88.22 | 71.64 |
| Himachal Pradesh | 1.47 | 1.49 | 1.44 | 1.43 | 1.33 |
| Jammu And Kashmir | 0.04 | 0.00 | 0.23 | 0.23 | 0.23 |
| Jharkhand | 0.00 | 0.00 | 0.00 | 0.00 | 0.45 |
| Karnataka | 443.00 | 637.00 | 659.40 | 543.00 | 540.00 |
| Kerala | 0.92 | 0.92 | 0.93 | 0.65 | 0.25 |
| Madhya Pradesh | 95.00 | 93.00 | 92.00 | 115.00 | 107.00 |
| Maharashtra | 1142.80 | 1261.70 | 1359.30 | 1437.02 | 1167.04 |
| Manipur | 4.94 | 4.94 | 5.03 | 4.96 | 5.96 |
| Meghalaya | 0.13 | 0.13 | 0.12 | 0.12 | 0.12 |
| Mizoram | 1.38 | 1.29 | 1.46 | 1.04 | 0.79 |
| Nagaland | 4.46 | 3.65 | 2.49 | 2.64 | 2.01 |
| Odisha | 7.00 | 7.05 | 7.33 | 7.18 | 13.26 |
| Puducherry | 1.34 | 0.00 | 1.34 | 1.23 | 0.75 |
| Punjab | 89.30 | 86.80 | 90.30 | 90.20 | 88.72 |
| Rajasthan | 4.98 | 4.24 | 3.53 | 4.16 | 5.82 |
| Tamil Nadu | 127.70 | 147.99 | 158.97 | 151.69 | 130.89 |
| Telangana | 22.00 | 28.00 | 28.00 | 27.00 | 20.59 |
| Tripura | 0.86 | 0.88 | 0.68 | 0.68 | 0.53 |
| Uttar Pradesh | 2180.00 | 2177.00 | 2794.55 | 2653.00 | 2720.40 |
| Uttarakhand | 46.00 | 44.00 | 47.00 | 94.09 | 90.37 |
| West Bengal | 18.80 | 18.98 | 18.45 | 16.58 | 13.21 |
| All India | 4851.23 | 5175.41 | 5885.32 | 5739.60 | 5449.93 |
This information was given by Minister of State for Agriculture and Farmers Welfare, Shri Ramnath Thakur in a written reply in Rajya Sabha recently.